DYNAMICS 365 HOW TO DEBUG PLUGINS USING REMOTE DEBUGGER
In another post,
we saw how to debug a plugin using Profiler and highlighted a downside of this method which will not give you a real-time state of the
Dynamics 365 database you are working on.
However, in this post, I will show you how to debug a plugin in real-time of the execution of the plugin itself using the Visual Studio
remote debugger tool.
This method will only work for On-premises environments since you should install and run the tool on the CRM server.
The below steps will teach you how to debug the plugins
- First things first, you have to download the remote debugger tool using this link based on the Visual Studio version you are working with
- Once the download is done, copy the installer on the CRM server and double click to install it
- When the installation is done, right click > Run as administrator
-
In the remote debugger popup that is opened, you can notice the server name with a port number.
Copy these information because they will be used in the next step within the Visual Studio

- In Visual Studio, build your plugin project and go to the Debug folder found under the project folder
- Copy the .pdb file of your plugin and paste it in the following folder of the CRM server C:\Program Files\Microsoft Dynamics CRM\Server\bin\assembly
- Register your plugin using the Plugin Registration Tool so the latest changes are applied to the CRM
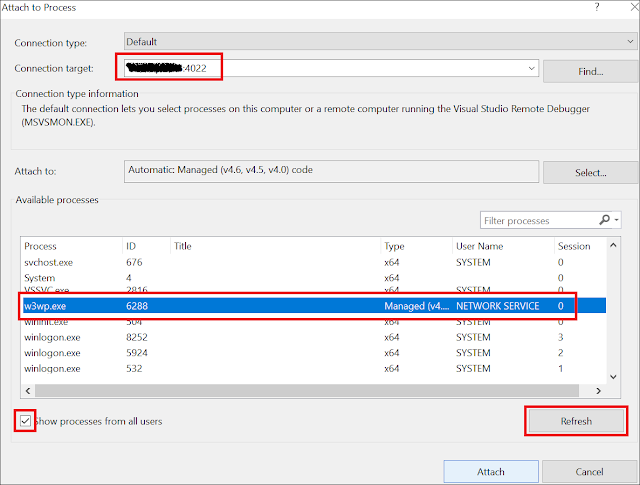
- Return to Visual Studio and from the menu select Debug > Attach to Process
- In the pop up window, for the Connection target option, enter the server name and port number you copied earlier from the remote debugger
-
Select the checkbox Show processes from all users and click Refresh button.
Scroll down to the end and select the process w3wp.exe and click Attach

-
Finally, set a breakpoint on the line of code where you want the debugger to stop and go to CRM
and execute the action that will trigger the plugin to be executed... Few seconds and the debugger will stop on your breakpoint

Bonus Tips:
- Work with the .dll and .pdb files generated from the same build action of the plugin project. Use the .dll in the Plugin Registration Tool and copy the .pdb to the CRM server
- In the attach process pop up window, select all the w3wp.exe in case of many processes
- You can debug the asynchronous plugin by attaching to the processes named CrmAsyncService.exe
Hope This Helps!


Excellent Blog!! Thanks for posting such a Useful Information.
ReplyDeleteAzure DevOps Online Training
Azure DevOps Training
Azure DevOps Online Training in Hyderabad
Azure Devops Training Online