DYNAMICS 365 HOW TO DEBUG A PLUGIN USING PLUGIN PROFILER
Often, you might face issue that it is not clear and you are not able to solve it due an error being raised in your plugins triggered.
Therefore, you are obliged to debug the plugin in order to troubleshoot and solve the problem.
In this post, you will learn how to debug your plugin of Dynamics 365 environment using Plugin Profiler
in the Plugin Registration Tool.
Below are the needed Step by Step procedure to debug a plugin
-
Installing Plugin Profiler
- Open the Plugin Registration Tool
- From the menu, click Install Profiler to install it
- Once the installation is done, you will get a notification

-
Start profiling
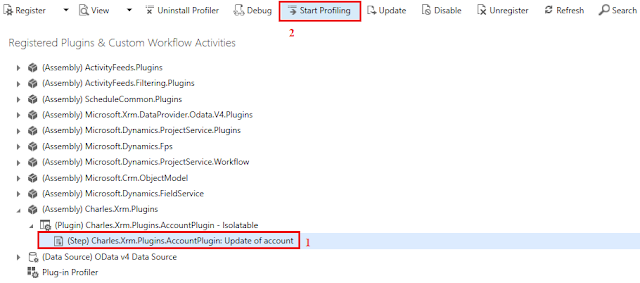
- In the Plugin Registration Tool, select the step you want to debug
- Click Start Profiling from the menu
-
Setting the Profiler
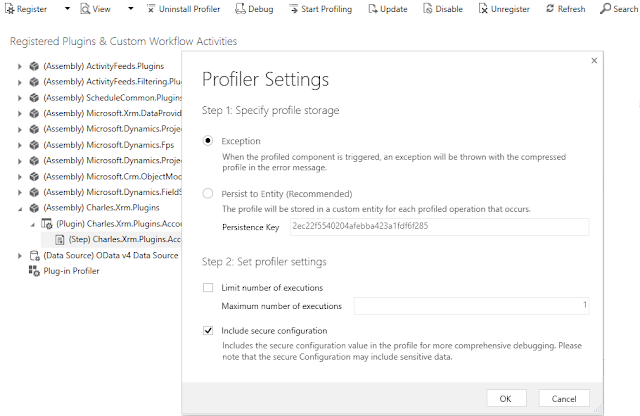
- Select Exception (the profiler will start execution if the plugin throws an exception which is our case, but you can change the options as per your needs)
- Enter the number of executions needed (1 is default value)
- Check if you want to include the secure configuration
- After the settings are entered, click OK
- The step will be marked as Profiled
-
Throwing exception
- Open Dynamics 365 environment
- Perform the operation on which the above step has been registered (Update of Relationship Type of an Account in our case)

-
Downloading Log File
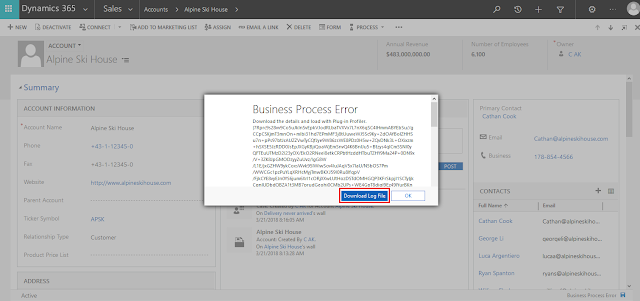
- In the UI, when the exception is thrown, the Business Process Error dialog will be displayed
- Click Download Log File to save it on your local machine (it'll be used in step 7)
-
Attaching to process the plugin in Visual Studio
- Open your plugin project in Visual Studio
- Open the plugin class
- Add a breakpoint in the beginning of your code
- Click Debug > Attach to Process
- Scroll down and select the process named PluginRegistration.exe

-
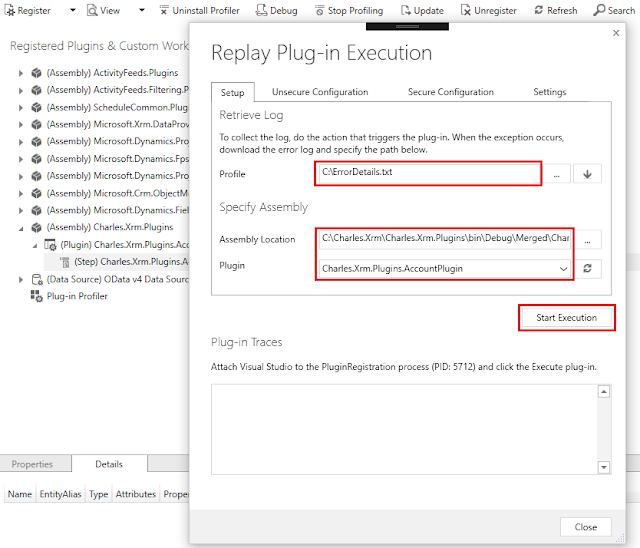
Replaying the plugin execution
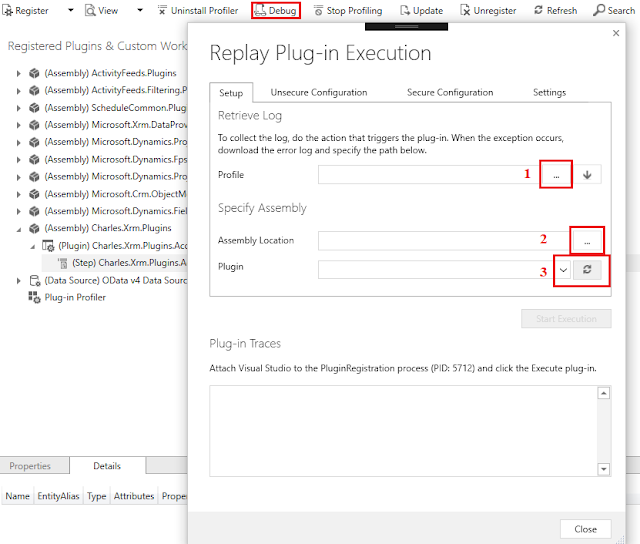
- In the Plugin Registration Tool, click Debug from the menu
- In the Profile section, select the log file you saved in step 5
- In the Assembly Location section, select the dll of your assembly project
- In the Plugin section, make sure that the profiled plugin step is selected
- Click Start Execution
-
Debugging the plugin
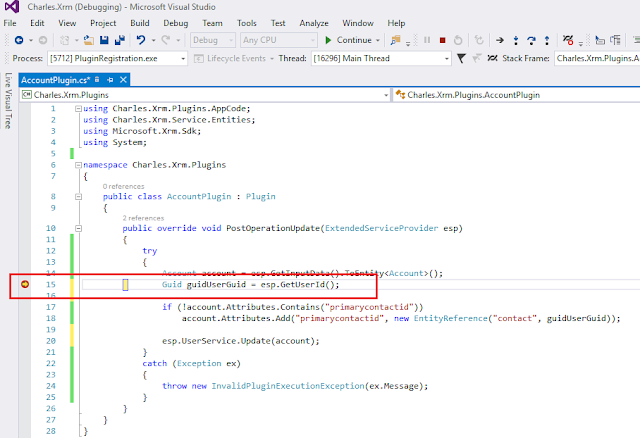
- As soon as you click on Start Execution, the debugger will stop at the breakpoint inserted in your code
- You can now debug the code line by line by pressing F10 and validate the reason of the exception thrown
-
Stopping profiler
- After you are done, open the Plugin Registration Tool
- From the menu, click Stop Profiling to stop profiling of the step
Bonus Tips:
- Plugin profiler is a very nice tool to debug plugins for Online environments; however, it will not give us a real-time state of the Dynamics 365 database we are working on because it will replay the execution from the log file we saved locally
- Another downside is that you cannot debug Custom Workflow Activities
- Previously, for on-premise environments, we were able to debug the plugins and workflow activities instantly while we are working in the CRM UI using Visual Studio IDE Remote Debugger that gives us real-time state of our CRM database
- For the ones who are interested to know how to debug the plugins using VS IDE tool, this link is very helpful
Hope This Helps!


Amazing Tutorial, Thank you.
ReplyDelete